
In this post we present the basis and possible applications of the spectral shape indices (SSI) which first proposed by members of this research team in 2006 (Palacios-Orueta et al., 2006). These indices are based on the angle formed at any vertex of three contiguous spectral bands in a multispectral broadband spectrum being computed easily by cosine theorem.
Unlike the majority of ratio indices that use two bands , the angles provide information about the relative behavior of the three band set summarizing the shape of the spectrum within their wavelength range. All the angles that we are able to extract from a spectrum of MODIS data are shown in Figure 1-A. Figure 1-B shows the application of cosine theorem to calculate AS1 index derived from NIR (860nm), SWIR1 (1240nm) and SWIR2 (1640 nm) and AS2 derived from SWIR1(1240nm), SWIR2 (1640 nm) and SWIR3 (2130 nm) MODIS spectral bands.

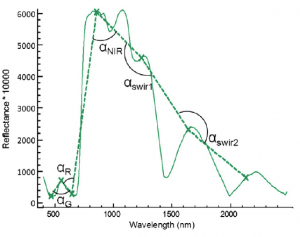
Figure 1: A) Spectral shape and angles located at MODIS bands central wavelength B) Calculation of AS1 and AS2 using the cosine theorem (From Palacios-Orueta et al., 2012)
Depending on the used spectral bands different information regarding to biophysical properties can be extracted. Indices centered in VNIR region provide information about processes related to vegetation pigments such as photosynthesis or greenness. However, indices centered in the SWIR region offer information about the vegetation water content and their application in land surface monitoring is specially interesting when photosynthetic activity is not the dominant process.
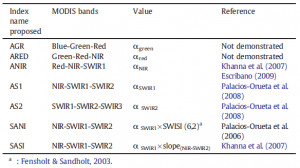
Table 1 Spectral Shape Indexes (SSI) proposed. The first column is the name proposed, the second column shows the three spectral bands used to calculate the index, the third column indicates their mathematical value, and the fourth column is the scientific publication in which it has been shown. (From Palacios-Orueta 2012).
Among the results of their application, Palacios-Orueta et al. (2006) showed a good performance of SANI in tracking moisture and discriminating between soil, vegetation and dry vegetation. In addition, they found significant differences between NDVI and SANI in response to precipitation with higher dynamic ranges and faster responses. Khanna et al. (2007) demonstrated that SASI is a good indicator of soil and vegetation moisture whereas ANIR is useful for discriminating dry plant matter from soil. They showed that combining SASI and ANIR indices improves land cover discrimination by highlighting the differences between soil, dry plant matter, and low to high amounts of green vegetation. Huesca et al., 2009 showed the usefulness of AS1 time series to discriminate three vegetation types under different climates. More recently, Palacios-Orueta et al. (2012) assessed AS1 and AS2 behavior over a cotton crop growing period and derived phenological metrics useful to monitor cotton phenological stages. Finally, Tornos et al. (2015) assessed dynamics of SASI and other spectral indices in relation to rice agricultural practices and hydroperiod. They showed that SASI was effectively used to assess variability out of the growing season being able to detect changes in soil water content and to identify the harvest and the end of environmental flooding.
Spectral Shape Indices: application to Doñana and Picos de Europa National Parks
References
- Escribano, P. (2009). Integración de técnicas espectrales para la detección y cuantificación de los tipos de cubiertas en ecosistemas áridos. Bases para un programa de seguimiento de pN Cabo de gata Níjar, Almeria (Doctoral dissertation, Universidad de Almeria).
- Fensholt, R., & Sandholt, I. (2003). Derivation of a shortwave infrared water stress index from MODIS near-and shortwave infrared data in a semiarid environment. Remote Sensing of Environment, 87(1), 111-121.
- Huesca, M., Litago, J., Escribano, P., Palacios-Orueta, A., & Merino-de-Miguel, S. (2009). Utilidad de los índices espectrales AS1 y AS2 para caracterizar tipos de vegetación en zonas bioclimáticas distintas mediante análisis de series de tiempo. In XIII Congreso Nacional de la AET (Calatayud-España).
- Khanna, S., Palacios-Orueta, A., Whiting, M. L., Ustin, S. L., Riaño, D., & Litago, J. (2007). Development of angle indexes for soil moisture estimation, dry matter detection and land-cover discrimination. Remote Sensing of Environment, 109(2), 154-165.
- Palacios-Orueta, A., Khanna, S., Litago, J., Whiting, M. L., & Ustin, S. L. (2006). Assessment of NDVI and NDWI spectral indices using MODIS time series analysis and development of a new spectral index based on MODIS shortwave infrared bands. In Proceedings of the 1st international conference of remote sensing and geoinformation processing (pp. 207-209). Trier, Germany. http://ubt, opus. hbz-nrw, de/volltexte/2006/362/pdf/03-rgldd-session2, pdf.
- Palacios-Orueta, A., Whiting, M. L., Ustin, S. L., Litago, J., Garcia, M., & Khanna, S. (2008). Cotton phenology analysis with the new remote sensing spectral angle indexes AS1 and AS2. In Agricultural and biosystems engineering for a sustainable world. International Conference on Agricultural Engineering, Hersonissos, Crete, Greece, 23-25 June, 2008. European Society of Agricultural Engineers (AgEng).
- Palacios-Orueta, A., Huesca, M., Whiting, M. L., Litago, J., Khanna, S., Garcia, M., & Ustin, S. L. (2012). Derivation of phenological metrics by function fitting to time-series of Spectral Shape Indexes AS1 and AS2: Mapping cotton phenological stages using MODIS time series. Remote sensing of environment, 126, 148-159.
- Tornos, L., Huesca, M., Dominguez, J. A., Moyano, M. C., Cicuendez, V., Recuero, L., & Palacios-Orueta, A. (2015). Assessment of MODIS spectral indices for determining rice paddy agricultural practices and hydroperiod. ISPRS Journal of Photogrammetry and Remote Sensing, 101, 110-124.
This article review about vegetation is really clear and easy to understand by whosoever that will come across this article. With the help of this post I have come to understand some importance of vegetation, I really want to thank you for sharing this with every one of us to also have little understanding about it.
Thank you for your interest