Analysis and Modeling of Rainfed Crops Dynamics Based on NDVI Time Series in Central Spain
In this study, we developed a prediction model for NDVI time series data obtained from the MODIS sensor, covering the period from 2002 to 2022, for rainfed crops near four meteorological stations in the province of Soria. The analysis was conducted at the pixel level, using the Box-Jenkins methodology, and the accuracy of the models was evaluated using the U-Theil index. We found that the models predicted with good accuracy for 30% of the analyzed pixels, with annual seasonality identified as a key factor. The results were published in Sáenz et al., 2023.
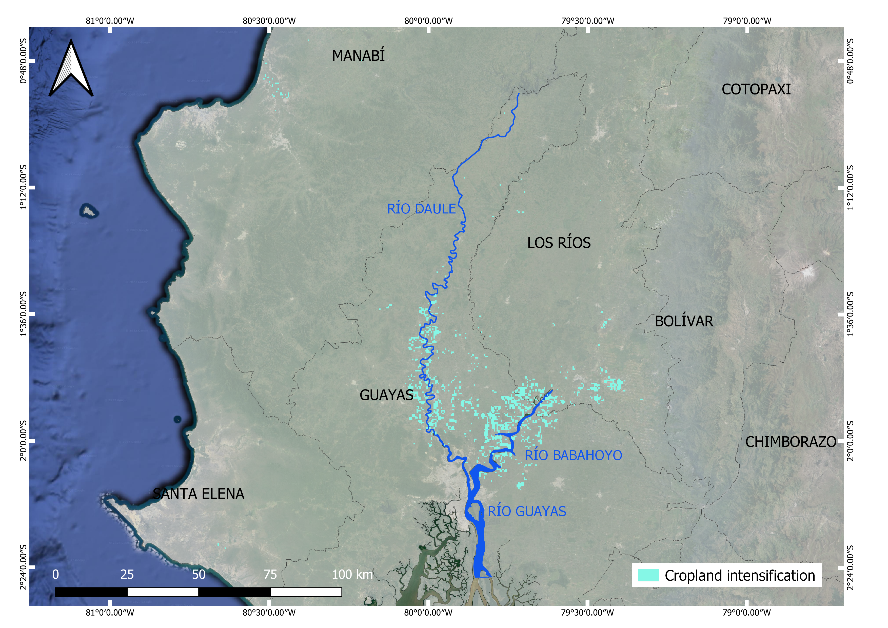
Evaluating Cropland Intensification in Ecuador: Insights from 20 Years of NDVI Data

We proposed a novel methodology based on the spectral analysis of remotes sensing time series to assess cropland intensification in Ecuador, a tropical region where cloud cover complicates crop monitoring. Using 20-year series of NDVI data from 2001 to 2020, we analyzed differences in the number of crop cycles in major rice and maize areas.
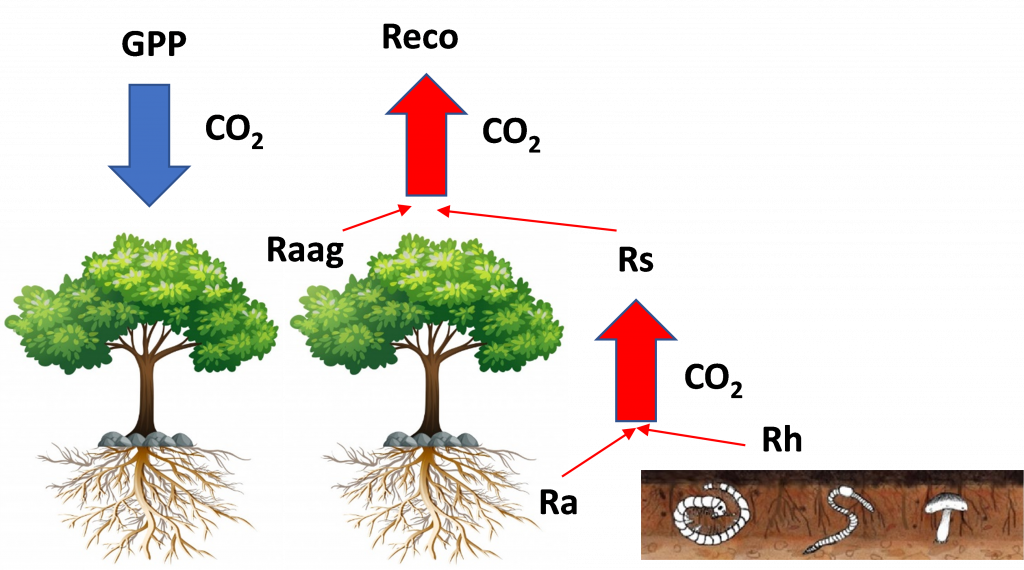
Assessment of different components of the Carbon flux in forest and agricultural ecosystems using remote sensing data and field measurements.

The two main components of the carbon cycle are Gross Primary Production (GPP) and Soil Respiration (Rs). We have assessed these two main components of the carbon cycle in agricultural and forest ecosystems by new remote sensing and field techniques.
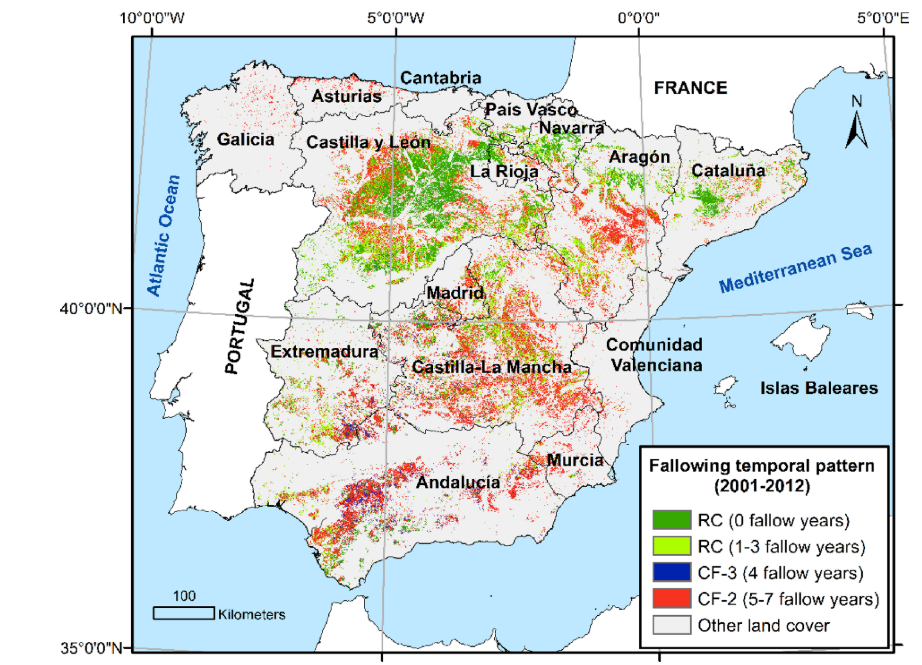
Mapping fallow lands, the forgotten land cover class

We proposed a new methodology based on NDVI time series autocorrelation values and machine learning algorithms to assess fallowing temporal patterns across rainfed agricultural areas that was tested in mainland Spain. See the spatial distribution in the post’s map viewer.
How are vegetation growing seasons around the world?
We identified the most relevant vegetation seasonal patterns based on spectral analysis of NDVI time series. Most of global land surface (93.18%) showed one intra-annual growing season whereas bi- and trimodal patterns occupy lower area (5.58%), mainly in tropical and arid regions along with agricultural areas. The highest values of amplitude and stability were found at Northern Hemisphere high latitudes whereas lowest values were located in tropical and arid regions. High presence of pluri-annual cycles was found in water-limited areas of Australia. See more in this article.
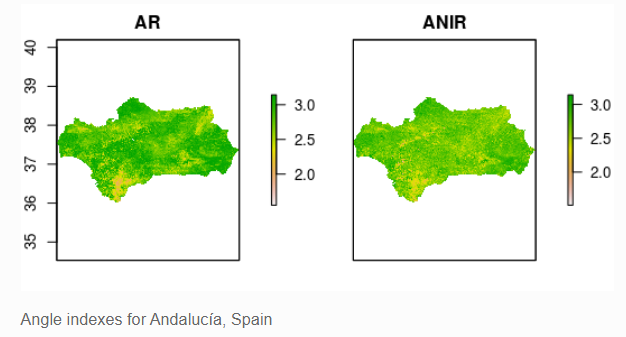
Spectral Shape Indexes (SSI): calculations using R, an aplication in Andalucía

Spectral Shape Indexes (SSI): basis and applications

In this post we present the basis and possible applications of the spectral shape indices (SSI) which first proposed by members of this research team in 2006 (Palacios-Orueta et al., 2006). These indices are based on the angle formed at any vertex of three contiguous spectral bands in a multispectral broadband spectrum being computed easily by cosine theorem.
