
Víctor González Linares. Senior Lecturer.
Santiago Vignote Peña. Professor.
Department of Forest & Environmental Engineering and Management.Technical University (UPM). Madrid.
The Spanish economy is slightly showing positive recovery signs. Construction figures and domestic consumption, which are the most relevant market drivers for forest products, are also somewhat better than in the last years. This article analyzes the projections for 2015 in several forest products markets. The conclusion is that a certain general improvement can be expected in most of them, though showing different figures and values.
1. – GENERAL ECONOMIC TRENDS.
The official estimations for 2015 confirm the upturn in the Spanish economy’s output. GDP increased 1% in 1st quarter 2015 and 0.8% in the 2nd quarter. These numbers were accompanied by improvement in job creation figures. The final forecast for GDP 2015 ranges from 2.5 to 3.1% depending on sources (chart 1).
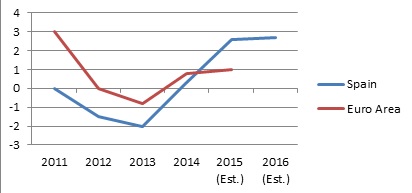
Chart 1: Gross Domestic Product, Spain/Euro Zone. (Source: Banco de España, Eurostat).
For 2016, the buoyant upturn is expected to continue, though a more contained path is being discernible in the second half of the current year, once the impact on the pace of GDP of some of the recent expansionary impulses, such as the fall in oil prices and the depreciation of the euro, begins to ease. The risks of slippage from this baseline scenario are balanced, although the recent volatility on financial markets heightens the uncertainty. Still, annual average growth of 2.7% is indicated as 2016 estimation in most of the reports.
After bottoming out at -0.1% last autumn, inflation rate has progressively risen up to 0.5% in May 2015, set against the cyclical improvement and the depreciation of the euro. This has been accompanied by something of a rise in inflation expectations in recent months. The projections for the rate of change of inflation are estimated to stand at -0.2% on average in 2015, rising to 1.3% in 2016 (chart 2), though latest estimations (September 2015) consider most probable a certain increase in this inflation rate projection.
- Chart 2: Index of Consumer Prices (Source: Banco de España, Eurostat).
In recent months, favourable developments in financial conditions in Spain have supported the buoyancy of the main components of domestic demand. Credit institutions have continued reducing the cost of new bank loans to households and firms. The volume of new lending business has continued to increase, while the pace of the decline in aggregate debt has eased. Household consumption is being driven by increased confidence and by the impact that
the favourable trend of labour income, lower oil prices and the personal income tax reform are exerting on household disposable income.
Business investment is being supported by the progressive improvement in financial determinants (table 1), in a setting in which the favourable demand outlook is fomenting the adoption of new investment projects. Overall, the strengthening of households’ and firms’ financial position is beginning to play a part in the non-financial private sector’s spending decisions. The contribution of net external demand is practically neutral but a growth of goods exports is expected during the year.
2014 |
2015 (Est.) |
2016 (Est.) |
|
|
GDP |
1,4 |
3,1 |
2,7 |
|
Private Consumption |
2,4 |
3,4 |
2,3 |
|
Government consumption |
0,1 |
0,1 |
0,1 |
|
Gross fixed capital formation |
3,4 |
5,9 |
6,1 |
|
Net external demand |
-0,8 |
0,0 |
0,1 |
|
Consumer price index |
-0,2 |
-0,2 |
1,3 |
|
Employment (Full time equivalents) |
1,2 |
2,9 |
2,6 |
Table 1: Projections of the Spanish Economy´s macroeconomic variables (annual rate of change in volume terms/% of GDP). (Source: Banco de España, INE).
The tourism, an essential sector for the Spanish economy, presage robust growth in activity. Imports from the rest of the world, associated with the consumer durable and investment good components, contribute also to the optimistic expectations, even though the bad economic environment during the last weeks of September has cooled down a bit the predictions.
Regarding the labour market, the already-high growth rate of employment quickened in the first half of 2015, continuing high job creation rates in the remaining productive sectors. In turn, registered unemployed numbers in the National Public Employment Service fell significantly (7.8% in May). Against this backdrop, the estimate is for a year-on-year rate of change of around 0.9% in the second half and for a further decline in the unemployment rate.
General parliament elections will take place in December 20th, bringing along a relative uncertainty. Therefore, it cannot be ruled out that the effects of some of the impulses currently operating may extend beyond the baseline scenario, with the result that the strong rate of recovery in domestic demand observed in the most recent period may continue in the coming months.
2. – FOREST PRODUCTS MARKET DRIVERS.
With respect to construction, which plays a key role in the Spanish forest product demand and is the key market driver for sawngoods, added-value goods, boards, plywood and veneer, the investment has turned upwards in 2015 after a long period of recession (table 2). The change in this trend is essential for the timber market. In the first half of 2015 the number of housing starts increased around 21,8% compared to previous year figures. Even small, this is the best increase in the sector since 2012.
2014 |
2015 (Est.) |
2016 (Est.) |
|
|
Investment in construction |
-1,5 |
4,8 |
4,5 |
|
Investment in capital goods |
12,2 |
8,8 |
8,9 |
Table 2: Spanish economy´s variables on construction (annual rate of change in volume terms/ % of GDP). (Source: Banco de España, INE).
Residential investment continues to show signs of an incipient recovery, as indicated both by the rise in building approvals and real estate transaction figures. Of course, they still remain at low levels, very far away from the record high figures of 2007, when Spanish housing starts reached 720000 units surpassing those of France, UK and Germany (together). After that, construction market dropped dramatically until this year (chart 3), when not only statistical figures are improving but also a slight increase in prices in certain real estate market segments has been noticed.
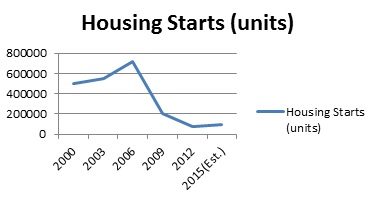
Chart 3: Housing starts in Spain. (Source: INE, Ministerio de Fomento).
The use of wood for construction is still small in Spain. Several initiatives have been developed to promote it in recent years, particularly “Building with Wood” and “Living with Wood”. Unfortunately, the leading organism in these activities, Confemadera (Spanish Timber Employers´ Association) has been very much affected by the crisis and the promotion activities are not significant at the moment.
Together with construction, the other key driver sectors for the Spanish forest product market are printing & packaging sectors which pull the pulp&paper production. Pulplog demand in Spain relies pretty much on eucalyptus pulp production, out of which more than half is usually exported. Pine pulp for packaging configures the smaller part of the pulp production. Domestic production of paper and board is mainly obtained from recycled paper. Therefore, the fundamentals to analyze pulp and paper are domestic demand, export of goods and imports (table 3). Good news is that they all show positive signs in estimations for 2015 & 2016.
|
2014 |
2015 (Est.) |
2016 (Est.) |
|
|
Exports of goods and services |
4,2 |
5,1 |
5,7 |
|
Imports of goods and services |
7,6 |
5,3 |
5,9 |
|
National demand |
2,2 |
3,1 |
2,6 |
Table 3: Projections of particular interest for the forest products market (annual rate of change in volume terms/% of GDP). (Source: Banco de España, INE).
3. – DEVELOPMENT IN FOREST PRODUCTS MARKET SECTOR.
3.0 MARKET HIGHLIGHTS FOR 2015
1.-Activity in 2015 is increasing in the forest product market in Spain.
2.-Production in sawmilling, boards and pulp industries shows positive signs and investments are being made in some existing factories.
| Timber product |
Value (thousand euro) |
|
Sawnwood |
65000 |
|
Fibreboard |
28000 |
|
Particleboard |
25000 |
|
Veneer |
22000 |
Table 4: Economic value of timber product imports during 1Q 2015 (Source: AEIM).
3.-Production increased in the first half in sawmilling industry and remained similar than in 2014 in paper and board.
4.- €/U$D Dollar exchange fluctuations are facilitating exports, particularly in sawmilling, board and pulp & paper industries.
5.-Imports of timber products (excluding furniture) increased 6% value-wise reaching around 274 million euro during 1st quarter 2015. The main import was sawnwood that represented 25% of total imports (65 million euro value) followed by fibreboard, particle board and veneer (table 4).
6.-Softwood sawngoods & veneer imports increased 36% compared to first quarter 2014 figures (CIF Value). Most of the timber products also increased between 3 and 22%.
7.-Hardwood roundwood imports (mainly eucalyptus logs) are the main exception, decreasing 50% from 2014 figures (table).
|
Timber product |
1Q 2014 |
1Q 2015 |
Difference (%) |
|
Softwood sawnwood |
29885 |
40531 |
+36 |
|
Softwood roundwood |
5550 |
5731 |
+3 |
|
Hardwood roundwood |
24591 |
12296 |
-50 |
|
Veneer |
19901 |
22095 |
+11 |
|
Plywood |
9976 |
13549 |
+36 |
|
Particle board |
23111 |
25537 |
+10 |
|
Laminated wood |
6362 |
6604 |
+4 |
|
Packaging & pallets |
10737 |
13080 |
+22 |
Table 5: CIF Value of timber product imports. Comparison January-March 2015/2014 (thousand euro). Source: AEIM.
8.-Furniture imports have increased +28% and exports +10%. The increase in domestic consumption of medium and low price furniture is being supplied with imports.
3.1 ROUNDWOOD.
In 2014 the roundwood production in Spain reached 19,5 million m3 ob / 16, 2 million m3 ub (table 6). This represents around 37% of the total annual growth (approx. 52 million m3 ob) and confirms the nonexistence of any overharvesting risk.
The total offer of roundwood in Spain will probably remain at similar levels for 2015: on the one hand there will be a certain increase in softwood due to the slight recovery in construction indicated in previous sections of this report plus the good activity of packaging material demand (palleting) and the positive trend in wood energy demand for smaller logs (domestic and exports); but on the other hand, the wood pulp activity will reflect (even if slightly) the closure of one of its plants last January. The owner company is planning to increase capacity in other group factories but still hardwood pulplog consumption will most probably not increase and the total roundwood balance will show neutral figures.
|
2014 |
2013 |
||
|
Total Roundwood |
19,5 |
18,9 |
|
|
Industrial roundwood |
15,3 |
15,1 |
|
|
Softwood |
5,9 |
5,5 |
|
|
Hardwood |
9,4 |
9,6 |
|
|
Fuelwood |
4,2 |
3,8 |
Table 6: Removals of roundwood and fuelwood, 2014 (Million m3 ob). (Source: Ministerio de Agricultura, Alimentación y Medio Ambiente -MAGRAMA)
As a matter of fact, the total figures for roundwood in 2014 and the estimation for 2015 are well in the limits of the stabilized Spanish industrial roundwood market offer, which has ranged between 14-16 million m3 ob in the last 3 decades (chart 4).
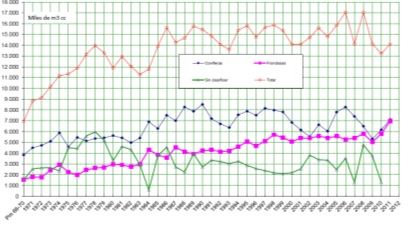
Chart 4: Removals of roundwood in Spain since 1970. (Source: F. Pinillos, 2014).
Hardwoods represented in 2014 61% of the total harvested volume, while softwood reached 39%. The split softwood/hardwood has changed in the last years: from a traditional position leaded by softwoods to a dominancy of hardwoods. The reduction of softwood in the market is bad news for proper forest management, as most of the 3 million ha planted in Spain in the second half of XXth Century were softwoods and there is a great need for silvicultural treatments, including thinning. It is generally considered that a demand for softwoods exists, particularly for sawngood products in which Spain is a regular heavy importer, though it is brought as sawn and wood products and not as roundwood.
In 2014 approx. 75% of the total felling ended up in pulpwood & board production and 25% was used for sawmill & plywood/veneer industries (table 7). The weight of pulp & board logs has increased regularly in the last 5 years, though previously it represented around 60% of the total felling. The construction crisis affecting sawmill industry has been a significant reason for this. The biggest part of the sawngoods produced are coniferous species.
|
2014 |
% of total |
2013 |
||
|
Industrial roundwood |
15154 |
100 |
15310 |
|
|
Sawmilling and Pluywood/Veneer |
3764 |
24 |
3405 |
|
|
Pulp & Board |
11487 |
74 |
11278 |
|
|
Other uses |
266 |
2% |
261 |
Table 7: Industrial end uses for the total industrial roundwood removals (m3 ob). (Source: Ministerio de Agricultura).
Eucalyptus was the leading harvested specie for industrial use, followed by Pinus pinaster & Pinus radiata. This 2014 data confirms the traditional figures from the last 10 years, as usually between 60-75% of the total cutting corresponded to this 3 species. Though there is still potential for an increase in this offer (harvesting pressure on this 3 species is shown in table 8), a widening in the productive range of species offer could be an interesting future option for the Spanish forest policy. But it would also precise industrial measures to develop the demand for new species too.
Populus sp are second to eucalyptus in hardwood removals, with an estimated yearly harvesting volume of 0,7 million m3, mainly aimed to plywood production and packaging. Board manufacturers and sawmill industry consumed mainly softwoods species, as well as packaging manufacturers (pallets).
|
Eucalyptus |
P. pinaster |
P. radiata |
|
|
Annual Growth (million m3 ob/year) |
5,1 |
6,2 |
2,6 |
|
Felling (% annual growth) |
81 |
44,9 |
67,5 |
|
Surface (thousand ha) |
460 |
1750 |
174 |
Table 8: Average data in annual growth, felling and surface for the 3 main productive Spanish species (Source: Vignote et al, 2013).
In 2014 the trade has shown positive balance in roundwood, as exports have increased while imports decreased (table 9). The trade of roundwood in Spain reflects a dominant regular flow of eucalyptus imports since the late seventies. The figures for 2014 show a total import amount of 1,2 million m3, whose almost exclusive end use is pulpwood production. Also export volumes of eucalyptus are significant: as a consequence of a mutual “hit and run” policy, Portuguese and Spanish pulp manufacturers buy continuous and similar volumes from the neighbor country. The amount of Spanish eucalyptus log export to Portugal will surely increase in 2015 due to the already mentioned shutdown of a pulp factory in South Spain.
The tropical roundwood imports are very much reduced. In the late XXth Century they represented over 200 000 m3/year; since then, they have decreased as a consequence of the trade control policy provoked by environmental and legislative concerns. Part of these imports has switched to sawnwood or added value goods form.
Finally, around 0,5 million m3 of coniferous logs are imported and around 1 million exported.
|
2014 |
2013 |
||
|
Roundwood imports |
1749 |
2047 |
|
|
Hardwood(excl. tropical) |
1292 |
1549 |
|
|
Tropical |
5 |
9 |
|
|
Softwood |
456 |
497 |
|
|
Roundwood exports |
2604 |
2488 |
|
|
Hardwoods (excl. tropical) |
1630 |
1846 |
|
|
Tropical |
0,2 |
0,1 |
|
|
Softwood |
973 |
641 |
Table 9: Roundwood trade by species (thousand m3). (Source: MAGRAMA)
3.2 WOOD ENERGY
Both wood fuel and wood pellet market showed increases in 2014 (table 10). And also the demand of roundwood for fuel competing with industrial uses (pulp & board) was significant. The wood energy market in 2014 & 2015 has kept positive fundamentals both in demand and price. This was the trend since 2011-2012, being the driving force the demand for wood to be used as heat producing fuels. Heat use has compensated the lower consumption for electricity that was negatively affected by the legislation approved in 2012 and the new energy tax established in 2013.
|
2014 |
2013 |
||
|
Wood fuel |
3435 |
3030 |
|
|
Softwood |
1195 |
|
|
|
Hardwood |
2240 |
|
|
|
Wood pellets |
Domestic |
350 |
250 |
|
Imported |
38 |
37 |
|
|
Exported |
39 |
46 |
Table 10: Figures for wood fuel production (thousand m3) and wood pellets production and trade (thousand tons). (Source: MAGRAMA).
The situation in first half 2015 shows good demand for domestic use and even better for export markets, being the main destinies Italy and France. The Spanish exports origins are located in the Mediterranean area. The increase in the demand for small diameter logs, particularly in softwood, has brought along an uptrend pressure in stumpage prices. There are over 30 pellet production plants in Spain, with a potential production capacity overpassing 800000 t/year. Actually the real production performance is around 35% of the total potential.
The Spanish legal framework for energy reflects the EU strategy and targets. The objectives established by the Central Government under PANER 2011-2020 (Renewable Energy National Plan) for solid biomass are 1350 MW in electricity and 52950 GWh in heat. This means a consumption objective for biomass of 9-11 million ton/year in 2020, with expected reduction savings of 180 million euro in CO2 emissions and 1200 million euro in oil imports.
3.3 SAWNGOODS.
Spanish sawmills suffered heavily during the recent economic crisis; even during the construction boom, important structural problems were detected but unfortunately not corrected. As a consequence, 20% of the sawmills did shutdown from 2008 to 2013, being particularly affected the “bigger” ones (for Spanish standards): 38% of the sawmills with more than 20 workers did close. The clear relation between production size and competitiveness makes particularly difficult the survival of many of the existing ones, which hardly can do the necessary investments. This is an urgent need in the case of those P. pinaster sawmills supplying joinery and construction qualities, as cannot compete against European imports.
The market situation has improved slightly in 2014-2015 (table 11). Sawmills related to construction and packaging have improved particularly in packaging qualities (pallet manufacturers). The domestic production in P. radiata has positive indexes, with investments and development of exports mainly to North African markets. The rate Euro/US dollar is a favourable factor for competitiveness. Only joinery sawmilling is still very much quiet, and the carcassing industry for construction has just restarted to move ahead now. Furniture suppliers are also in dire straits since the beginning of the economic crisis.
Regarding trade, the sawngoods market in Spain shows a traditional dependence on softwood imports; the main suppliers are France and Portugal for Pinus pinaster, which has a strong demand related to their traditional production in Spain. These two countries lead the figures so far also in 2015. The dominant origins for better qualities have, long since, been Sweden & Finland. But in the last decade, also Central European countries have played a significant role, particularly in glue lam and other structural wood products.
|
Sawnwood market in Spain 2014 |
2014 (x 1000 m3) |
|
Production |
2046 |
|
Softwoods |
1661 |
|
Hardwoods |
385 |
|
Imports |
1017 |
|
Softwoods |
852 |
|
Hardwoods |
164 |
|
Tropical |
41 |
|
Exports |
216 |
|
Softwoods |
183 |
|
Hardwoods |
29 |
|
Tropical |
4 |
Table 11: Sawnwood market in Spain 2014 (thousand m3). (Source: Ministerio de Agricultura, AEIM).
Flooring, paneling and other similar products were being used in an increasing way during the building boom that ended in 2007; after that, a regular demand exists but on much smaller basis. Nevertheless, the potential for timber products in the construction market is big as their market share compared to alternative building materials is still pretty small. Added-value products including Glue-lam and EGP (Engineering Wood Products) are only marginal but have a great potential to grow. It is anyhow necessary to invest in formative actions and in promotion.
3.4 PULP & PAPER.
Pulp and paper overpassed the Spanish crisis better than most of the sectors. The hardest times occurred in 2009, and after that, an improvement in the situation has raised back the sector turnover to a standstill level (chart 5). Year 2015 (so far) is maintaining this situation.
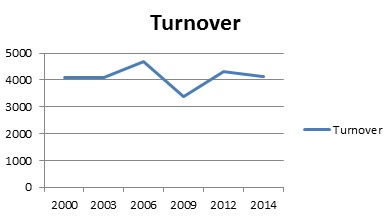
Chart 5: Pulp & Paper total turnover (million €/year). (Source: Aspapel).
The 2014 consumption of pulplogs in Spain to produce virgin fibre pulp was 5.6 million m3 ub. The composition by species indicates that 80% (4.5 million m3 ub) was Eucalyptus sp and 20% (1.5 million m3 ub) was Pinus sp. The split of these data by origin is as follows: 3.3 million m3 ub had Spanish origin in eucalyptus & 1.2 million m3 ub was imported. Regarding coniferous, 99% of the pine logs had domestic origin.
|
x 1.000 m3 |
2014 |
2013 |
|
Eucalyptus |
4525,2 |
5009,8 |
|
Domestic |
3310,8 |
3779,3 |
|
Imported |
1214,4 |
1230,5 |
|
Pine |
1153,0 |
1130,3 |
|
Domestic |
1145,0 |
1130,3 |
|
Imported |
8 |
0 |
|
TOTAL |
5678,2 |
6140,1 |
The total production of virgin fibre pulp in 2014 reached 1,8 million tons, slightly less than in previous years. 59% of this amount was exported, mainly to UE countries (73% of total exports). There are 8 active pulp factories in Spain in 2015, being most of them non-integrated.
Spain is the 6th biggest European producer of paper & board (P&B). In 2014, P&B production was 6,036 million tons, but 81% of this total was obtained from waste paper/recycled fibre, using both domestic and imported residues. Therefore, only 19 tons out of each 100 of P&B are made from virgin fibre pulp in Spain (with domestic and imported pulp), which is an essential data for linking properly the Spanish forest and the paper production.
|
(x 10 3 Ton) |
Paper and board 2014 |
Paper and board 2013 |
Pulp 2014 |
Pulp 2013 |
|
Production |
6036 |
6181 |
1863 |
1977 |
|
Consumption |
6257 |
6085 |
1813 |
1921 |
|
Imports |
3108 |
2822 |
1151 |
1119 |
|
Exports |
2915 |
3047 |
1115 |
1217 |
Table 13: Main figures for pulp & paper production in Spain (thousands tons).
(Source: MAGRAMA, Aspapel).
In 2014 the P&B consumption of pulp showed a certain increase compared to 2013; but the production decreased 2,3% and exports also decreased (4,3%). Export figures achieved 49% of the total in tons, but 63% of the total turnover, being essential for the economic welfare of the sector. The estimations for 2015 show a similar situation in all variables.
Apart from market concerns, a big controversial regarding the energy supply/production of pulp and paper factories is taking place as a consequence of the change in the Spanish law regarding energy co-generation since July 2013, that has been negatively received by the sector and has affected their financial results during 2013 & 2014.
|
Raw material consumption |
2014 |
2013 |
Unit |
|
Roundwood |
5678,2 |
6140,1 |
103 m3 ub |
|
Recycled |
5052,9 |
5145,1 |
103 t |
Table 14: Main figures for pulp & paper raw material sources in Spain (thousands tons except roundwood, thousand m3 ub). (Source: MAGRAMA, Aspapel).
3.5 WOOD BASED PANELS.
Wood based panel also had good activity in first half 2015 and some production increases and even investments are taking place in the factories. This is a positive change in the industrial trend, as in 2014 one of the biggest MDF factories closed and others suffered severe difficulties. Main customers for the board manufacturers in Spain are furniture and components, door factories, construction and flooring. Plywood production is mainly based on poplar, though it is usually complemented by tropical woods.
The trade in wood based panels also shows better signs in 2015 than in previous years. The expected increase in volume for 2015 is +6% and in value +9%. The figures by sectors show differences, as follows:
– Fibreboard is the most relevant sector in Spanish wood based panels trade volume-wise. Both import and export volumes rose during the last years, though the export figures are bigger, with +13% increase.
– Spain is traditionally an import market for veneers and the expectations in 2015 are +38% in imports value. In 2013/2014 the increase was also relevant (30%).
– Particleboards has shown a clear decrease in export and an increase in import during 2014. The export balance was +50% and the estimates for 2014/2015 are +11%.
– Plywood trade is also going up in both import and export, with optimistic expectations for 2015. The poplar plywood exports to UE are significant, and represent quality end uses (mobile homes, sauna manufacturers, etc.) as well as packaging.
|
2014 |
2013 |
||
|
Particleboard |
|||
|
Production |
1300 |
1320 |
|
|
Imports |
302 |
250 |
|
|
Exports |
380 |
386 |
|
|
Fibreboard |
|||
|
MDF |
Production |
1092 |
1093 |
|
|
Imports |
185 |
199 |
|
|
Exports |
556 |
567 |
|
Hardboard & others |
Production |
135 |
144 |
|
|
Imports |
57 |
57 |
|
|
Exports |
97 |
117 |
|
Plywood |
|||
|
Production |
280 |
275 |
|
|
Imports |
67 |
52 |
|
|
Exports |
123 |
115 |
|
|
Veneer |
|||
|
Production |
110 |
111 |
|
|
Imports |
70 |
61 |
|
|
Exports |
28 |
31 |
Table 15: Principal figures for the wood based panel market in Spain (Thousand tons). (Source: Production: MAGRAMA; Trade: Ministerio de Economía).
3.6 FURNITURE
The furniture estimates for 2015 are positively affected by the increase in turnover numbers. The domestic consumption has increased, particularly in middle and low price furniture segments. But due to the decrease in the number of local manufacturers in recent years, the consumption increase is mainly based on imports, as Spain is a furniture net importer.
|
First half 2015 |
Change 2014/2015 (%) |
|
|
China |
333 |
+32 |
|
Portugal |
167 |
+8 |
|
Italy |
115 |
+12 |
|
Germany |
134 |
-2 |
|
France |
89 |
+15 |
|
Poland |
112 |
+56 |
|
Morocco |
45 |
+26 |
Table 16: Principal figures for furniture imports during first half 2015 (million euro) and comparison 2014/2015 (%). (Source: ANIEME).
The increase in imports is very relevant: +20.8% (first half 2014/2015). China is the main supplier (25% of total imports value-wise) and has swallowed most of the import increase (+32% in first half 2014/2015). 5 different EU countries are its followers. Also the export sales during first half 2015 increased, but the total economic value (1.030 million euro) is smaller than the value of imports. Anyway, export increased +10% in comparison with first half 2014. Main destinies are UE countries though marginal volumes are also sent to other destinations.
REFERENCES
AEIM, Estadísticas de importación. Julio 2015.
ANIEME, Estadísticas de exportación. Septiembre 2015.
ASPAPEL, Memoria de Sostenibilidad 2014.
Banco de España, Informe trimestral sobre la economía española. Julio 2015.
Instituto Nacional de Estadística, 2015. INE Base.
Ministerio de Agricultura, Alimentación y Medio Ambiente, Estadísticas del sector forestal, 2015.
Ministerio de Agricultura, Alimentación y Medio Ambiente. Diagnóstico del sector forestal español (Análisis y prospectiva). Octubre 2014.
Ministerio de Economía. URL www.datacomex.comercio.es
Santiago Vignote et al. Producción maderera en el mundo y en España. URL http//blogs.upm.es/forest.