In this tutorial, we describe how to use the ICA utilities provided by Atlas.ti v9 [1] (from now on, shortened as Atlas) as well as a guide for interpreting of the obtained results. We will assume that the reader is familiar with the general operation of Atlas and focus on the computation and evaluation of the different ICA coefficients calculated by Atlas.
The is structured as follows. First, we describe the different operation methods provided by Atlas for the computation of ICA. Then, we describe briefly the protocol for analyzing case study research involving qualitative data analysis in software engineering and we introduce a running example on the topic that will serve as a guide along all the tutorial. Finally, we discuss the calculation, interpretation and validity conclusions that can be drawn from the ICA coefficients provided by Atlas.
Coefficients in Atlas for the computation of ICA
Atlas provides three different methods for computing the agreement between coders, namely simple percent agreement, Holsti Index, and Krippendorff’s 𝛼 coefficients.
Simple percent agreement and Holsti Index
It is well reported in the literature that simple percent agreement is not a valid ICA measure, since it does not take into account the agreement that the coders can be attained by chance. On the other hand, the Holsti Index [2] is a variation of the percent agreement that can be applied when there are no pre-defined quotations and each coder selects the matter that considers relevant. Nevertheless, as in the case of the percent agreement, it ignores the agreement by chance so it is not suitable for a rigorous analysis. In any case, Atlas provides us these measures that allow us to glance at the results and to get an idea of the distribution of the codes. However, they should not be used for drawing any conclusions about the validity of the coding. For this reason, in this tutorial we will focus on the application and interpretation of Krippendorff’s 𝛼 coefficients.
Krippendorff’s 𝛼 in Atlas
Atlas also provides an integrated method for computing the Krippendorff’s 𝛼 coefficients. However, it may be difficult at a first sight to identify the prompted results since the notation is not fully consistent between Atlas and some reports in the literature. The development of the different versions of the 𝛼 coefficient has taken around fifty years and, during this time, the notation for its several variants has changed. Now, a variety of notations co-exists in the literature that may confuse the unfamiliar reader with this ICA measure. In order to clarify these relations, in this tutorial we always use a notation based on the ones provided by Atlas, but some slightly differences can be appreciated. For the convenience of the reader, in the following table we include a comparative between the original Krippendorff’s notation, the Atlas notation for the 𝛼 coefficient and the notation used in this tutorial.
Empirically, we have discovered that the semantics that the software Atlas applies for computing the coefficients 𝛼𝑏𝑖𝑛𝑎𝑟𝑦/𝛼𝑔𝑙𝑏𝑖𝑛𝑎𝑟𝑦 and 𝑐𝑢-𝛼/𝐶𝑢-𝛼 are the ones explained in this tutorial.
| Name | Krippendorff’s | Atlas | This tutorial |
| Global binary 𝛼 | 𝑢𝛼 | alpha-binary (global) | 𝛼𝑔𝑙𝑏𝑖𝑛𝑎𝑟𝑦 |
| Binary 𝛼 per semantic domain | |𝑐𝑢𝛼,|𝑢𝛼 | alpha-binary (semantic domain) | 𝛼𝑏𝑖𝑛𝑎𝑟𝑦 |
| cu-𝛼 | (𝑠)𝑢𝛼,(𝑘)𝑢𝛼 | cu-alpha | cu-𝛼 |
| Cu-𝛼 | 𝑆𝑢𝛼 | Cu-alpha | Cu-𝛼 |
Case study: instilling DevOps culture in software companies
This tutorial uses as guiding example an excerpt of a research conducted by the authors in the domain of DevOps [3]. The considered example is an exploratory study to characterize the reasons why companies move to DevOps and what results do they expect to obtain when adopting the DevOps culture [4]. This exploratory case study is based on interviews to software practitioners from 30 multinational software-intensive companies. The study has been conducted according to the guidelines for performing qualitative research in software engineering proposed by Wohlin et al. [5].
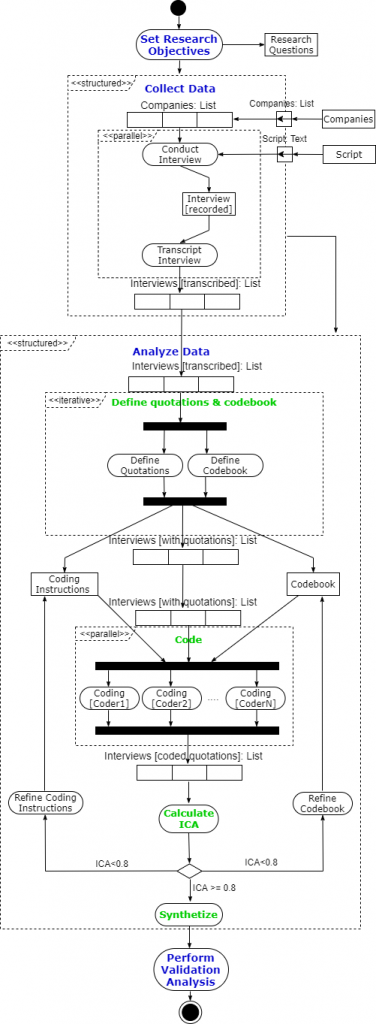
In the following figure we show, through a UML activity diagram [6], the different stages that comprise the above-mentioned study. For the sake of completeness, in the following exposition each step of the analysis is accompanied with a brief explanation of the underlying qualitative research methodology that the authors carried out. For a complete description of the methodology in qualitative research and thematic analysis, please check the aforementioned references.
Set research objectives
The first step needed for conducting an exploratory study is to define the aim of the prospective work, the so-called research question (RQ). These objectives must be clearly stated and the boundaries of each research question should be undoubtedly demarcated.
In the case study of the running example presented in this paper, we propose one research question related to the implications of instilling a DevOps culture in a company, which is the main concern of the analysis.
RQ: What problems do companies try to solve by implementing DevOps?
Collect data
The next step in the research is to collect the empirical evidences needed for understanding the phenomenon under study. Data is the only window that the researchers have to the object of research, so getting high quality data typically leads to good researches. As a rule-of-thumb, the better the data, the more precise the conclusions can be drawn.
There are two main methods for collecting information in qualitative analysis, and both are particularly useful in software engineering: questionnaires and interviews [5]. Usually, questionnaires are easier to issue, since they can be provided by email or web pages that can be access whenever is preferable for the person in charge of answering it. On the other hand, interviews tent to gather a more complete picture of the phenomenon under study since there exists an active interaction between interviewer and interviewee, typically face to face. In this way, interviews are usually better suited for case studies since they allow the researcher to modify the questions to be asked on the fly, in order to emphasize the key points under analysis. As a drawback, typically the number of answers that can be obtained through a questionnaire is much larger than the number of interviews that can be conducted, but the later usually lead to higher quality data.
In the study considered in this paper, the data collection method was semi-structured interviews to software practitioners of 30 companies. The interviews were conducted face-to-face, using the Spanish language, and the audio was recorded with the permission of the participants, transcribed for the purpose of data analysis, and reviewed by respondents. In the transcripts, the companies were anonymized by assigning them an individual identification number from ID01 to ID30. The full script of the interview is available at the project’s web: https://blogs.upm.es/devopsinpractice.
Analyze data
This is the most important phase in the study. In this step, the researchers turn the raw data into structured and logically interconnected conclusions. On the other hand, due to its creative component, it is the less straightforward phase in the cycle.
To help researchers to analyze the data and to draw the conclusions, there exists several methods for qualitative data analysis that can be followed. In the DevOps exploratory study considered here, the authors conducted a thematic analysis approach [7] [8]. Thematic analysis is a method for identifying, analyzing, and reporting patterns within the data. For that purpose, the data is chopped into small pieces of information, the quotations or segments, that are minimal units of data. Then, some individuals (typically some of the researchers) act as coders, codifying the segments to highlight the relevant information and to assign it a condensate description, the code. In the literature, codes are defined as “descriptive labels that are applied to segments of text from each study” [7]. In order to easy the task of the coders, the codes can be grouped into bigger categories that share come higher level characteristics, forming the semantic domains (also known as themes in this context). This introduce a multi-level coding that usually leads to richer analysis.
A very important point is that splitting of the matter under study into quotations can be provided by a non-coder individual (typically, the thematic analysis designer), or it can be a task delegated to the coders. In the former case, all the coders work with the same segments, so it is easier to achieve a high level of consensus that leads to high reliability in the results of the analysis. In the later case, the coders can decide by themselves how to cut the stream of data, so hidden phenomena can be uncovered. However, the cuts may vary from a coder to another, so there exists a high risk of getting too diverse codings that cannot be analyzed under a common framework.
Thematic analysis can be instrumented through Atlas [1] [8], which provides an integrated framework for defining the quotations, codes and semantic domains, as well as for gathering the codings and to compute the attained ICA.
In the study considered in this section, the method for data analysis followed is described in the four phases described below.
(1) Define quotations & codebook: In the study under consideration, the coders used pre-defined quotations. In this way, once the interviews were transcripted, researcher R1 chopped the data into its unit segments that remain unalterable during the subsequent phases. In parallel, R1 elaborated a codebook by collecting all the available codes and their aggregation into semantic domains. After completing the codebook, R1 also created a guide with detailed instructions about how to use the codebook and how to apply the codes.
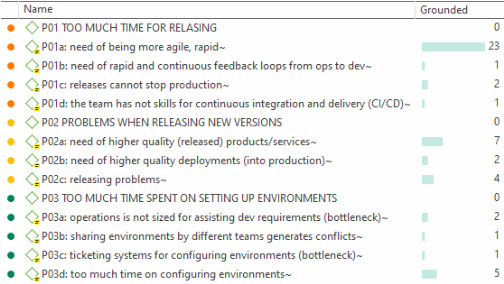
The design of the codebook is accomplished through two different approaches: a deductive approach [9] for creating semantic domains and an inductive approach [10] for creating codes. In the first phase, the deductive approach, R1 created a list of of semantic domains in which codes will be grouped inductively during the second phase. These initial domains integrate concepts known in the literature. Each domain is named P01, P02, P03, etc. Domains were written with uppercase letters as depicted in the following figure.
In the second phase, the inductive approach, R1 approached the data (i.e.\ the interviews’ transcriptions) with the research question RQ in mind. R1 reviewed the data line by line and created the quotations. R1 also assigned them a code (new or previously defined) in order to get a comprehensive list of all the needed codes. As more interviews were analyzed, the resulting codebook was refined by using a constant comparison method that forced R1 to go back and forth.
Additionally, the codes were complemented with a brief explanation of the concept they describe. This allows R1 to guarantee that the collection of created codes satisfy the requirements imposed by thematic analysis, namely exhaustiveness and mutual exclusiveness. The exhaustiveness requirement means that the codes of the codebook must cover all the relevant aspects for the research. Mutual exclusiveness means that there must exist no overlapping in the semantics of each code within a semantic domain. In this way, the codes of a particular semantic domain must capture disjoint aspects and complementary aspects, which implies that the codes should have explicit boundaries so that they are not interchangeable or redundant. This mutual exclusiveness translates into the fact that, during the coding phase, a coder cannot apply several codes of the same semantic domain to the same quotation. In other words, each coder can apply at most a code of each semantic domain to each quotation.
(2) Code: In this phase, the chosen coders (usually researchers different than the codebook designer) analyze the prescribed quotations created during phase (1). For that purpose, they use the codebook as a statement of the available semantic domains and codes as well as the definitions of each one, scope of application and boundaries. It is crucial for the process that the coders apply the codes exactly as described in the codebook. No modifications on the fly or alternative interpretations are acceptable.
Nevertheless, the coders are encourage to annotate any problem, diffuse limit or misdefinition they find during the coding process. After the coding process ends, if the coders consider that the codebook was not clear enough or the ICA measured in phase (3) does not reach an acceptable level, the coders and the codebook designer can meet to discuss the found problems. With this information, the codebook designer creates a new codebook and instructions for coding that can be used for a second round of codings. This iterative process can be conducted as many times as needed until the coders consider that the codebook is precise enough and the ICA measures certify an acceptable amount of reliability.
In the case study of ICA considered in this paper, the coding process involved two researchers different than R1, that acted as coders C1 and C2. They coded the matter according to the codebook created by R1.
(3) Calculate ICA: It is a quite common misconception in qualitative research that no numerical calculations can be performed for the study. Qualitative research aims to understand very complex an unstructured phenomena, for which a semantic analysis of the different facets and their variations is required. However, by no means this implies that no mathematical measures can be obtained for controlling the process. Due to its broad and flexible nature, qualitative research is highly sensible to introduce biases in the judgements of the researchers, so it is mandatory to supervise the research through some reliability measure that are usually numerical [11]. In this way, the quantitative approach takes place in a higher level, as meta-analysis of the conducted process in order to guarantee mathematical reliability in the drawn conclusions. Only when this formal quality assurance process is satisfactory, researchers can trust in the conclusions and the method is sound and complete.
Therefore, to avoid biases and be confident that the codes mean the same to anyone who uses them, it is necessary to build that confidence. According to Krippendorff [11], reliability grounds this confidence empirically and offers the certainty that research findings can be reproduced.
In the presented example about a DevOps case study, we used Inter-Coder Agreement (ICA) analysis techniques for testing the reliability of the obtained codebook. In this way, after coding, another researcher, R4, calculated and interpreted the ICA between C1 and C2. If coders did not reach an acceptable level of reliability, R1 analyzes the disagreements pointed out by R4 to find out why C1 and C2 had not understood a code in the same mode.
Using this acquired knowledge, R1 delivers a refined new version of the codebook and the accompanying use instructions. R1 also reviews the coding of those quotations that led to disagreement between C1 and C2, modifying it according to the new codebook when necessary. Notice that, if a code disappears in the new version of the codebook, it also must disappear of all the quotations that were asigned with it.
At this point, C1 and C2 can continue coding on a new subset of interviews’ transcriptions. This process is repeated until the ICA reached an acceptable level of reliability (typicall ≥ 0.8). In the next section it is provided a detailed explanation about how to compute and interpret ICA coeffients in Atlas.
(4) Synthetize: Once the loop (1)-(2)-(3) has been completed because the ICA measures reached an acceptable threshold, we can rely in the output of the coding process and start drawing conclusions. At this point, there exists a consensus about the meaning, applicability and limits of the codes and semantic domains of the codebook.
Using this processed information, this phase aims to provide a description of higher-order themes, a taxonomy, a model, or a theory. The first action is to determine how many times each domain appears in the data in order to estimate its relevance (grounded) and to support the analysis with evidences through quotations from the interviews. After that, the co-occurrence table between semantic units should be computed, that is, the table that collects the number of times a semantic domain appears jointly with the other domains. With these data, semantic networks can be created in order to portray the relationships between domains (association, causality, etc.) as well as the relationship strength based on co-occurrence. These relations determine the density of the domains, i.e.\ the number of domains you have related to each domain. If further information is needed, it is possible to repeat these actions for each code within a domain.
All these synthesis actions are not the main focus of this paper, so we will not describe them further. For more information and techniques, please refer to [5].
Perform validation analysis
As a final step, it is necessary to discuss in which way the obtained analysis and drawn conclusions are valid, as well as the threats to the validity that may jeopardize the study. In the words of Wohlin [5] “The validity of a study denotes the trustworthiness of the results, and to what extent the results are true and not biased by the researchers’ subjective point of view“.
There are several strategies for approaching to the validity analysis of the procedure. In the aforementioned case study, it was followed the methodology suggested by Creswell & Creswell [12] to improve the validity of exploratory case studies, namely data triangulation, member checking, rich description, clarify bias, and report discrepant information. Most of these methods are out of the scope of this paper and are not described further (for more information, check [12] [5]). We mainly focus on reducing authors bias by evaluating the reliability and consistency of the codebook on which the study findings are based through ICA analysis.
ICA calculation
This section describes how to perform the ICA analysis required using Atlas to assess the validity of the exploratory study described in the previous section. In this way, we will monitor the evolution of the 𝛼 coefficients along the coding process in order to assure it reaches an acceptable threshold of reliability, as mentioned in the previous subsection analyze data.
Nevertheless, before starting the coding/evaluation protocol, it is worthy to consider two important methodological aspects, as described below.
- The number of coders. Undoubtedly, the higher the number of involved coders, the richer the coding process. Krippendorff’s 𝛼 coefficients can be applied to an arbitrary number of coders, so there exists no intrinsic limitation to this number. On the other hand, a high number of coders may introduce too many different interpretations that may difficult to reach an agreement. In this way, it is important to find a fair balance between the number of coders and the time to reach agreement. For that purpose, it may be useful to take into account the number of interviews to be analyzed, its length and the resulting total amount of quotations. In the case study analyzed in this section, two coders, C1 and C2 were considered for coding excerpts extracted from 30 interviews.
- The extend of the coding/evaluation loop. A first approach to the data analysis process would be to let the coders codify the whole corpus of interviews, and to get an resulting ICA measure when the coding is completed. However, if the obtained ICA is below the acceptable threshold (say 0.8), the only solution that can be given is to refine the codebook and to re-codify the whole corpus again. This is a slow and repetitive protocol that can lead to intrinsic deviations in the subsequent codings due to cognitive biases in the coders. In this way, it is more convenient to follow an iterative approach that avoids these problems and speeds up the process. In this approach, the ICA coefficient is screened on several partially completed codings. To be precise, the designer of the case study splits the interviews into several subsets. The coders process the first subset and, after that, the ICA coefficients are computed. If this value is below the threshold of acceptance (0.8), there exists a disagreement between the coders when applying the codebook. At this point, the designer can use the partial coding to detect the problematic codes and to offer a refined version of the codebook and the accompanying instructions. Of course, after this revision, the previously coded matter should be updated with the new codes. With this new codebook, the coders can face the next subset of interviews, in the expectation that the newer version of the codebook will lead to decrease the disagreement. This reduces the number of complete codings needed to achieve an acceptable agreement. In the case study considered as example, the first batch of interviews comprised the first 19 interviews (ID01 to ID19). The attained ICA was unsatisfactory, so the codebook designer R1 reviewed the codebook releasing a new version. With the updated codebook, the coders codified the remaining 11 interviews (ID20 to ID30) but, now, the obtained ICA pass the acceptance threshold, which evidences a high level of reliability in the evaluations. As a final remark, it is not recommendable to replace the coders during this iterative process. Despite that Krippendorff’s 𝛼 allows to exchange coders, the new coders may not share the same vision and expertice with the codebook, requiring to roll back to previous versions.
Now, we present the calculation and interpretation of each of the four coefficients mentioned at the beginning of this tutorial. In order to emphasize the methodological aspects of the process, we focus only on some illustrative instances for each of the two rounds of the coding/evaluation protocol.
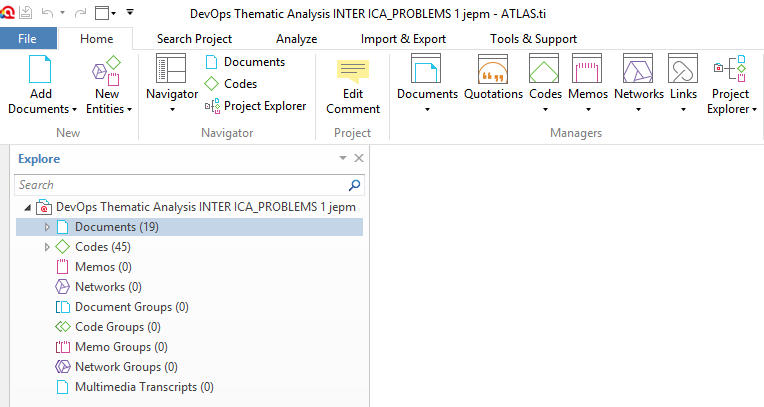
The first step in order to address the ICA analysis is to create an Atlas project and to introduce the semantic domains and codes compiled in the codebook. In addition, all the interviews (and their respective quotations, previously defined by R1) should be loaded as separated documents and all the codings performed by the coders should be integrated in the Atlas project. This is a straightforward process that is detailed in the Atlas’ user manual [1].
To illustrate our case study, we have a project containing the codings of the two coders for the first 19 interviews. The codebook has 10 semantic domains and 35 codes as depicted in the following figure. Observe that Atlas reports a total of 45 codes, since it treats semantic domains as codes (despite that it will work as an aggregation of codes for ICA purposes).
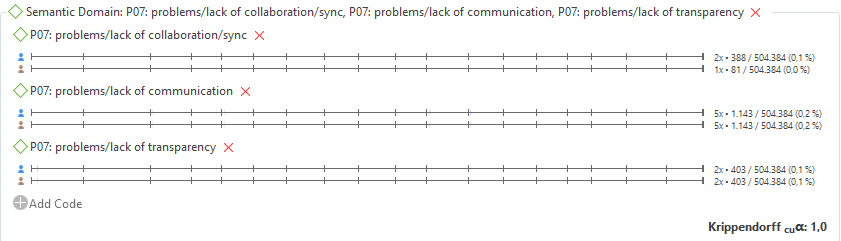
Now, we should select the semantic domains we wish to analyze, and the codes within them. For example, in the following figure, the three codes associated to semantic domain P07 have been added.
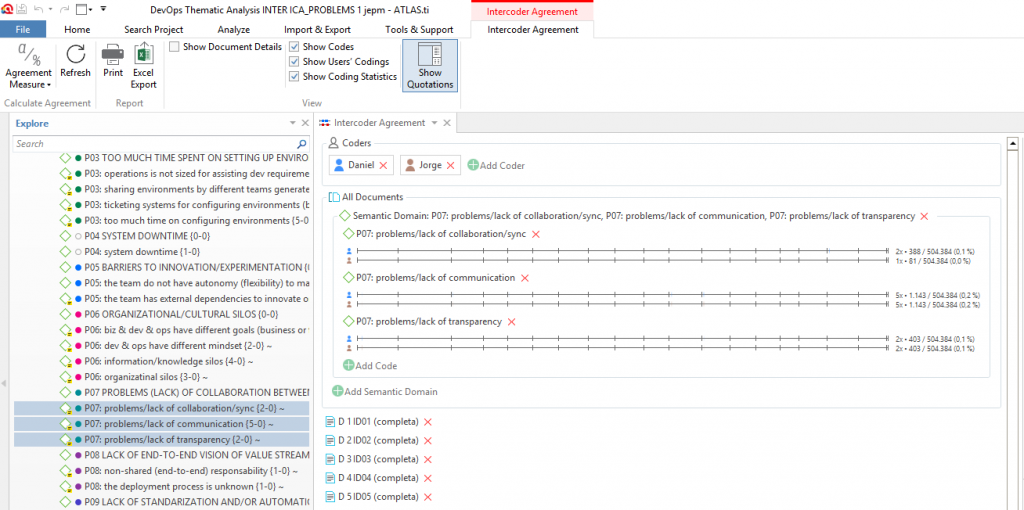
After adding a semantic domain and its codes, Atlas automatically plots a graphical representation. For each code, this graph is made of as many horizontal lines as coders (two, in our running example) that are identified with a small icon on the left. Each line is divided into segments that represent each of the documents added for analysis.
As can be checked in the following figure, there are two coders (Daniel and Jorge, represented with blue and brown icons respectively) and the semantic domain P07 has three associated codes, so three groups of pairs of horizontal lines are depicted. In addition, since we selected 19 documents for this coding round, the lines are divided into 19 segments (notice that the last one is very short and it can be barely seen). Observe that the length of each segment is proportional to the total length of the file.
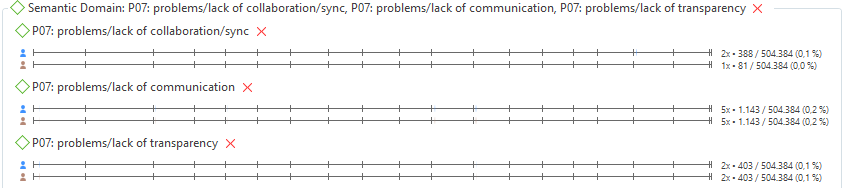
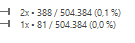
Moreover, on the right of the horizontal lines we find a sequence of numbers organized into two groups separated by a slash. For example, in the next figure we can see those numbers for the first code of P07 (problems/lack of collaboration/sync). The left-most group shows the number of quotations to which the corresponding code has been applied by the coder along all the documents, as well as the total length (i.e.\ the number of characters) of the chosen quotations. In the example depicted in the figure, the first coder (Daniel) used the first code twice, and the total length of the chosen quotations is 388; while the second coder (Jorge) used the first code only once on a quotation of length 81.
On the other hand, the right-most group indicates the total length of the analyzed documents (in particular, it is a constant independent of the chosen code, semantic domain or coder). This total length is accompanied with the rate of the coded quotations among the whole corpus. In this example, the total length of the documents to be analyzed is 504.384 and the coded quotations (with a total length of 388 and 81 respectively) represent the 0.076% and the 0.016% of the corpus (rounded to 0.1% and 0.0% in the Atlas representation). Recall that these lengths of the coded quotations and total corpus play an important role in the computation of the 𝛼 coefficient.
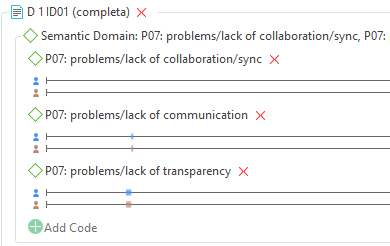
Each time that a coder uses a code, a small coloured mark is placed in the position of the quotation within the document. The colour of the mark agrees with the assigned color to the coder, and its length corresponds to the length of the coded quotation. Due to the short length of the chosen quotations in the following figure they are barely seen, but we can zoom in by choosing the Show Documents Details in the Atlas interface. In the next figure, we can check that, in document ID01, both coders agreed to codify two quotations (of different length) with the second and third codes of P07.
The 𝛼 𝑏𝑖𝑛𝑎𝑟𝑦 coefficient
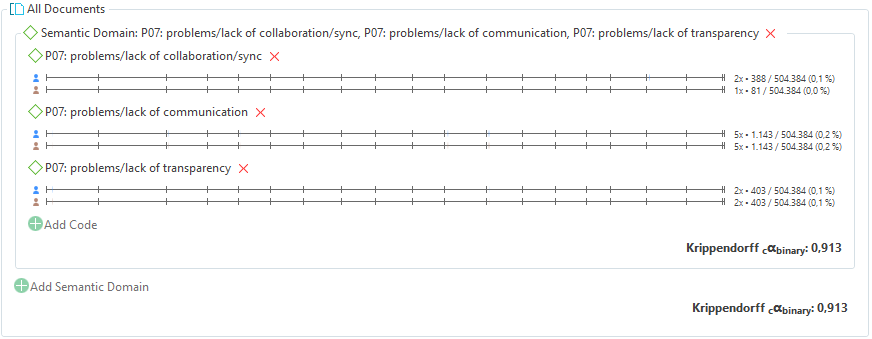
In order to compute this coefficient, click on the Agreement Measure button and select Krippendorff’s c-Alpha-binary option. As it is shown in the following figure, the system returns two values. The first one is the 𝛼𝑏𝑖𝑛𝑎𝑟𝑦 coefficient per semantic domain (P07 in this case, with 𝛼P07𝑏𝑖𝑛𝑎𝑟𝑦 = 0.913) an another global coefficient of the domains as a whole that corresponds to what we called 𝛼𝑔𝑙𝑏𝑖𝑛𝑎𝑟𝑦. Since we selected a single semantic domain (P07), both values of 𝛼𝑏𝑖𝑛𝑎𝑟𝑦 and 𝛼𝑔𝑙𝑏𝑖𝑛𝑎𝑟𝑦 agree.
In the case shown in the figure, the value of the coefficient is high (𝛼P07𝑏𝑖𝑛𝑎𝑟𝑦 = 0.913 > 0.8) which can be interpreted as an evidence that the domain P07 is clearly stated, its boundaries are well-defined and, thus, the decision of applying it or not is near to be deterministic. However, observe that this does not measure the degree of agreement in the application of the different codes within the domain P07. It might occur that the boundaries of the domain P07 are clearly defined but the inner codes are not well chosen. This is not a task of the 𝛼𝑏𝑖𝑛𝑎𝑟𝑦 , but of the cu-𝛼 coefficient.
In order to illustrate how Atlas performed the previous computation, let us calculate 𝛼𝑏𝑖𝑛𝑎𝑟𝑦 by hand. For this purpose, we export the information provided by Atlas about the coding process. In order to do so, we click on the Excel Export button at the Intercoder Agreement panel. In the next figure we show the part of the exported information that is relevant for our analysis. As we can see, there are two coders (Jorge and Daniel) and three codes. The meaning of each column is as follows:
- Applied: Number of times the code has been applied.
- Units: Number of units to which the code has been applied.
- Total Units: Total number of units across all selected documents, voted or not.
- Total Coverage: Percentage of coverage in the selected documents
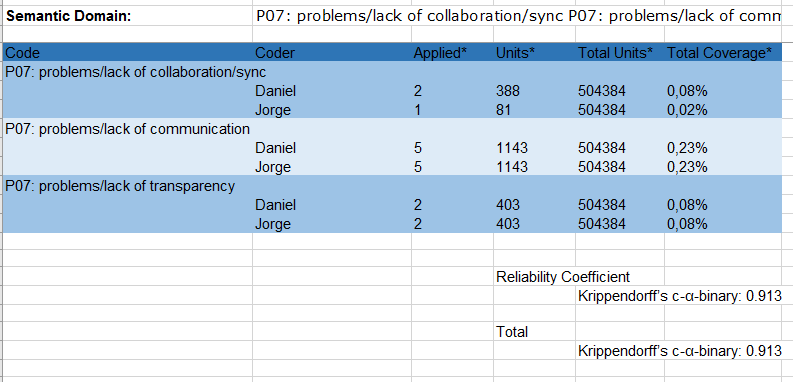
The length of the quotation (what is called units in Atlas) is expressed in number of characters. From this information, we see that coder Daniel voted 388 units (characters) with the first code of the domain (problems/lack of collaboration/sync) while coder Jorge only voted 81 units with that code. For the others codes, both coders apply them to 1143 and 403 units, respectively. Indeed, as we will check later, the quotations that Jorge chose for applying P07 are actually a subset of the ones chosen by Daniel. Hence, Daniel and Jorge achieved perfect agreement when applying the second and third codes of P07 while Jorge only considered eligible 81 units for the first code of the 388 chosen by Daniel.
From these data, we can construct the observed coincidence matrix, shown in the following table. Label 1 means that the coder voted the quotation with a code of the semantic domain (P07 in this case) and the label 0 means that no code of the domain was applied.
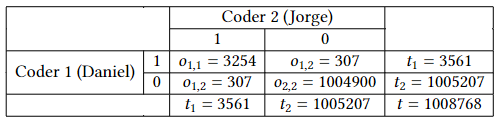
This matrix is computed as follows. The number of units to which the coders assigned any code from domain P07 is 81 + 1143 + 403=1627 in the case of Jorge and 388 + 1143 + 403 = 1934 for Daniel. Since the choices of Jorge are a subset of the ones of Daniel, we get that they agreed in 1627 = min(1627, 1934) units. Recall that 𝑜1,1 counts ordered pairs of votes, so we need to double the contribution to get 𝑜1,1 = 2 x 1627 = 3254. On the other hand, Jorge did not apply any code of P07 to 504384 – 1627 = 502757 units, while Daniel did not apply them to 504384 – 1934 = 502450, which means that they agreed on not to chose P07 in 502450 = min(502757, 502450) units. Doubling the contribution, we get 𝑜2,2 = 1004900. Finally, for the disagreements we find that Daniel applied a code from P07 to 307 units that Jorge did not select, so we get that 𝑜1,2 = 𝑜2,1 = 307. Observe that we do not have to double this value, since there is already an implicit order in this votes (Daniel voted 1 and Jorge voted 0). From these data, it is straightforward to compute the aggregated quantities t1 = 𝑜1,1 + 𝑜1,2 = 3561, t2 = 𝑜1,2 + 𝑜2,2 = 1005207 and t = t1 + t2 = 1008768.
In the same vein, we can construct the matrix of expected coincidences. The value of the expected disagreements are:
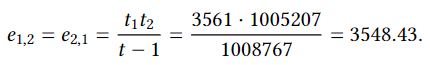
Analogously, we can compute e1,1 and e2,2. However, they are not actually needed for computing the 𝛼 coefficient, so we will skip them. With these calculations, we finally get that

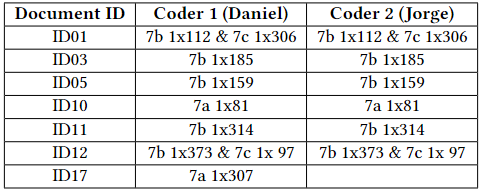
We want to notice again that the previous calculation is correct because Jorge voted with a code of P07 a subset of the quotations that Daniel selected for domain P07. We can check this claim using Atlas. For that purpose, click on Show Documents Details and review how the codes were assigned per document. In the case considered here, the following table shows an excerpt of the displayed information. To shorten the notation, the first code of P07 is denoted by 7a, the second one by 7b, and the third one by 7c. In this table, we see that all the voted elements coincide except the last 307 units corresponding to document ID17, that Daniel codified and Jorge did not.
Another example of calculation of this coefficient is shown in the following figure. It refers to the computation of the same coefficient, 𝛼P07𝑏𝑖𝑛𝑎𝑟𝑦, but in the second round of the coding process, where 11 documents were analyzed. We focus on this case because it shows a cumbersome effect of the 𝛼 coefficient.
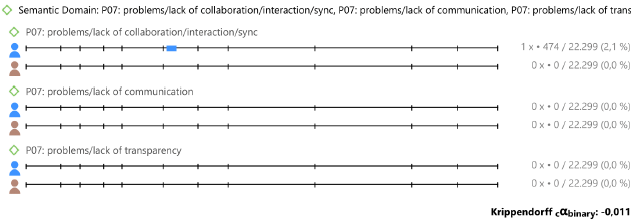
As shown in the figure, we get a value of 𝛼P07𝑏𝑖𝑛𝑎𝑟𝑦 = -0.011. This is an extremely small value, that might even point out to a deliberate disagreement between the coders. However, this is not happening here, but an undesirable statistical effect that fakes the result. The point is that, as shown in the figure, in round 2 there is only one evaluation from one of the coders that assigns this semantic domain, in contrast with the 17 evaluations obtained in round 1. For this reason, there are not enough data for evaluating this domain in round 2 and, thus, this result can be attributed to statistical outliers.
The researcher interested in using Atlas for qualitative research should stay alert to this annoying phenomenon. When Atlas considers that there are not enough statistical evidences (p-value > 0.05) or the number of coded quotations is very small, these anomalous values can be obtained or even the text N/A (Not Available). In this case, thanks to the few received codings, the reliability may be assessed by hand.
The 𝛼𝑔𝑙𝑏𝑖𝑛𝑎𝑟𝑦 coefficient
The 𝛼𝑔𝑙𝑏𝑖𝑛𝑎𝑟𝑦 coefficient allows researchers to measure the degree of agreement that the coders reached when distinguishing relevant and irrelevant matter. In this way, 𝛼𝑔𝑙𝑏𝑖𝑛𝑎𝑟𝑦 is only useful if each coder chops the matter by him/herself to select the relevant information to code. On the other hand, if the codebook designer pre-defines the quotations to be evaluated, this coefficient is no longer useful since it always attains the value 𝛼𝑔𝑙𝑏𝑖𝑛𝑎𝑟𝑦 = 1$. This later situation is the case in our running example.
Recall that, as we previously mentioned, the 𝛼𝑔𝑙𝑏𝑖𝑛𝑎𝑟𝑦 coefficient is automatically computed when we select the c-Alpha-binary option in Atlas. It is displayed at the bottom of the results, below all the 𝛼𝑏𝑖𝑛𝑎𝑟𝑦 coefficients, as a summary of the reliability in the semantic domains.
Nevertheless, in the calculation performed in the previous section we got a value 𝛼𝑔𝑙𝑏𝑖𝑛𝑎𝑟𝑦 = 0.931 < 1, which apparently contradicts the aforementioned fact that with pre-defined quotations always perfect agreement is achieved. Recall that this coefficients evaluates the agreement of the coders when trying to discern which parts of the matter are relevant (quotations) and which ones are not. In other words, this coefficient distinguish coded matter (with any code) and non-coded matter. If we would introduce in Atlas all the domains, all the pre-defined quotations will have, at least, a code assigned, and the rest of the matter will not receive any code. In this way, we would get 𝛼𝑔𝑙𝑏𝑖𝑛𝑎𝑟𝑦 = 1, since there exists perfect agreement between the relevant matter (the quotations) and the irrelevant matter.
The key point here is that, in the calculation of the section “The 𝛼𝑏𝑖𝑛𝑎𝑟𝑦 coefficient” we do not introduced in Atlas all the semantic domains, but only P07. In this way, the 𝛼𝑔𝑙𝑏𝑖𝑛𝑎𝑟𝑦 coefficient were not computed over the whole corpus. In other words, since we only added to the ICA tool the codes belonging to P07, the Atlas’ analyzer considered that these are all the codes that exist in the codebook, and anything that did not receive a code of P07 is seen as irrelevant matter. In this way, the quotation (made of 307 units) that Daniel chose for applying the code 7a and Jorge did not is considered by the ICA tool as a quotation that Daniel saw as relevant matter and Jorge as irrelevant matter, decreasing the value of 𝛼𝑔𝑙𝑏𝑖𝑛𝑎𝑟𝑦 .
If we conduct the analysis over all the codes of the codebooks it turns out that Jorge applied to this quotation a code from a different semantic domain so these 307 units are actually relevant matter, restoring the expected value 𝛼𝑔𝑙𝑏𝑖𝑛𝑎𝑟𝑦 = 1. The same result is obtained if we select a subset of domains in which the coders used codes of the subset on the same quotations (even if they did not agree on the particular codes), as shown the following figure for domains P01 and P08.
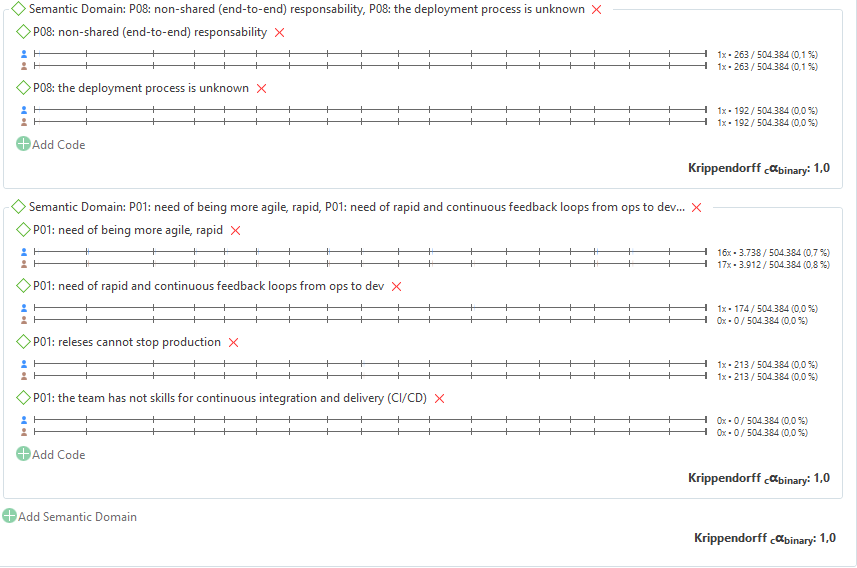
For this reason, it is crucial to evaluate the global 𝛼 coefficients (namely, 𝛼𝑔𝑙𝑏𝑖𝑛𝑎𝑟𝑦 and Cu-𝛼) only when all the codes have been added to the ICA tool. Otherwise, the result might be wrong and may lead to confusions.
The 𝑐𝑢-𝛼 and 𝐶𝑢-𝛼 coefficients
In some sense, the binary coefficients 𝛼𝑏𝑖𝑛𝑎𝑟𝑦 and 𝛼𝑔𝑙𝑏𝑖𝑛𝑎𝑟𝑦 evaluate whether to apply a particular semantic domain or not is well-defined in the codebook. They are binary measures, in the sense that they test a binary question: to apply some domain or not.
On the other hand, in this section we will consider the cu-𝛼 and Cu-𝛼 coefficients that, roughly speaking, zoom in to measure the limits of definition of the semantic domains themselves and of the codes within them. The cu-𝛼 coefficient is computed per semantic domain. Hence, fixed a domain S, it evaluates the amount of agreement that the coders reached when choosing to apply some code of S or other. It is, therefore, a measure of the reliability in the application of the codes withing S, not of the domains themselves. Analogously, Cu-𝛼 is a global measure that allows us to assess the limits of definitions of the semantic domains. In other words, it measures the goodness of the partition of the codebook into semantic domains, independently of the chosen code.
These two later coefficients can be easily computed with Atlas. For that purpose, click on the option Cu-Alpha/cu-Alpha in the ICA pannel, under the Agreement Measure button. In the following table, we show the obtained results of cu-𝛼 for each of 10 semantic domains of the running example considered in this section in the first round.
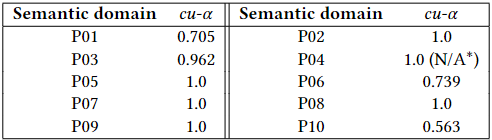
Observe that cu-𝛼 attained its maximum value, cu-𝛼= 1, over the domains P02, P05, P07, P08, and P09. This may seem counterintuitive at a first sight since, as can be checked in the following figure and as we previosly mentioned, in P07 there is no perfect agreement. Indeed, as we know the code of P07 “problems/lack of collaboration/sync” was chosen by Daniel for a quotation that Jorge skipped. Recall that, fixed a domain S, in the observed coincidences matrix only quotations were voted with codes of S by at least two different coders count. Otherwise, these quotations do not contribute with a pair of disagreements so, through the eyes of cu-𝛼, they do not compromise the reliability.
This fact is precisely what is taking place in this case. The quotation voted by Daniel with a code of P07 and not by Jorge does not appear in the observed coincidences matrix for cu-𝛼P07, neither as an agreement or as a disagreement. This allows cu-𝛼P07 = 1 even though there is no perfect agreement in the evaluation. This might seem awkward, but it actually makes sense since this disagreement was already detected via 𝛼P07𝑏𝑖𝑛𝑎𝑟𝑦 < 1, so decreasing also cu-𝛼P07 would count it twice. The same scenario occurs in domains P02 and P09.
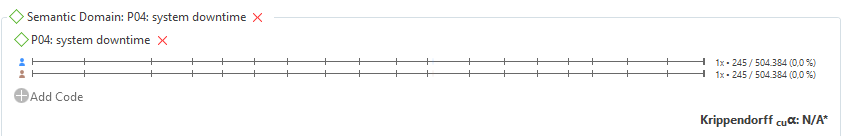
Special mention deserves the semantic domain P04 (see the following figure), that was evaluated as N/A*. Here, visual inspection shows that both coders do actually codify the same quotation with the same code. However, since only a single quotation was judged with a code of this domain, Atlas considers that there is not enough variability for providing statistical confidence (i.e. the p-value is above 0.05) to draw reliable conclusions. As we previously mentioned, a manual verification of the agreement is required in this case in order to assess the reliability.
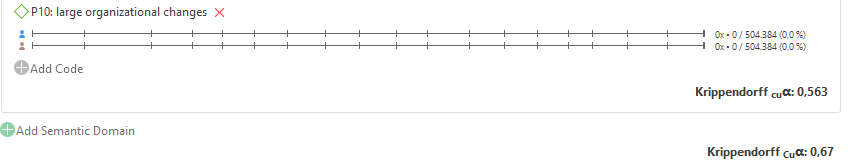
Finally, as it can be checked in the next figure, the Cu-𝛼 coefficient reached a value of 0.67, which is slightly above the lower threshold of applicability of 0.667. This suggests that the limits of definition of the semantic domains are a bit diffuse and can be improved. This problem was addressed in the second version of the codebook, in which a better definition of the domains allowed us to increase Cu-𝛼 to 0.905, which is a sound evidence of reliability.
REFERENCES
[1] ATLAS.ti Scientific Software Development GmbH. Inter-coder agreement analysis: Atlas.ti 9, 2020.
[2] O. R. Holsti. Content analysis for the social sciences and humanities. Reading. MA: Addison-Wesley (content analysis), 1969
[3] J. Diaz, D. López-Fernández, J. Perez, and Á. González-Prieto. Why are many business instilling a devops culture into their organization? Empir Software Eng 26, 25, 2021.
[4] L. Leite, C. Rocha, F. Kon, D. Milojicic, and P. Meirelles. A survey of devops concepts and challenges. ACM Comput. Surv., 52(6), 2019.
[5] C. Wohlin, P. Runeson, M. Höst, M. C. Ohlsson, B. Regnell, and A. Wesslén. Experimentation in software engineering. Springer Science & Business Media, 2012.
[6] J. Rumbaugh, I. Jacobson, and G. Booch. The unified modeling language. Reference manual, 1999.
[7] D. S. Cruzes and T. Dyba. Recommended steps for thematic synthesis in software engineering. In 2011 international symposium on empirical software engineering and measurement, pages 275–284. IEEE, 2011.
[8] J. Thomas and A. Harden. Methods for the thematic synthesis of qualitative research in systematic reviews. BMC medical research methodology, 8(1):45, 2008.
[9] M. B. Miles and A. M. Huberman. Qualitative data analysis: An expanded sourcebook. sage, 1994
[10] J. Corbin and A. Strauss. Techniques and procedures for developing grounded theory. Basics of Qualitative Research, 3rd ed.; Sage: Thousand Oaks, CA, USA, 2008.
[11] K. Krippendorff. Content analysis: An introduction to its methodology, 4rd edition. Sage publications, 2018.
[12] J. W. Creswell and J. D. Creswell. Research design: Qualitative, quantitative, and mixed methods approaches. Sage publications, 2017.